In the high-speed manufacturing world, planning and scheduling are more than timelines.They define your ability to complete and deliver on time, maximize resources, and remain competitive.
But, how do you know if your plans are working?
That’s where Key Performance Indicators, or KPIs, become so important. KPIs provide a means to assess operational performance, identify bottlenecks, and make data-guided decisions. Whether you run a single plant or a globally diverse production network, the right KPIs will drive improved efficiency and dependability.
This post will identify the top 10 KPIs all manufacturers should track to plan and schedule effectively.
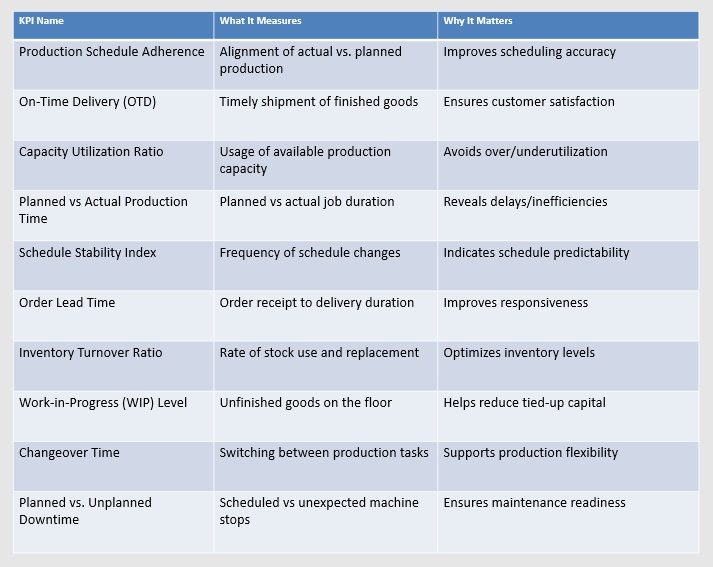
Production Schedule Adherence (%)
Production Schedule Adherence tells you how well your actual production aligns with the planned schedule. It is calculated as the percentage of jobs completed on time.
A low adherence may indicate flawed planning, faulty machines, or resource constraints. Tracking this KPI is an opportunity to hone scheduling accuracy and predictability.
On-Time Delivery (OTD) (%)
On-Time Delivery measures how much you ship finished goods as promised to your customers.
OTD equates directly to customer satisfaction and trust. When OTD transactions correlate to historical standards, they showcase timing adherence in planning and execution.
Capacity Utilization Ratio
This metric will tell you the fraction of your manufacturing capacity that you use.
Underutilization = wasted resources. Overutilization = stress on machines or people. Balancing capacity utilization is important for sustainable production.
Planned vs Actual Production Time
This KPI compares how long you planned the job would take versus how long it took.
Discrepancies here can highlight hidden delays, inefficiencies, or cumulative machine downtime. Over time you will refine the time you estimate for jobs.
Schedule Stability Index
This measures how stable your production schedule is after you finalize it.
A high failure rate for schedule changes indicates that your planning is unstable and you are always reactive in your decision-making. A predictable schedule means a smoother operation and happier crew members.
Order Lead Time
Order Lead Time measures the timings associated with receiving an order from a customer to the time you actually have the product delivered to them.
Better responsiveness equals shorter lead times equals happier customers. This also helps you identify which parts of your process are holding up planning, procurement, or production.
Inventory Turnover Ratio
Inventory Turnover indicates how fast your stock can be used and replaced.
A higher turnover indicates better material planning and less risk of excess and stockouts. It is a measurement of how effective your planning is to support production demand.
Work-in-Progress (WIP) Level
This characteristic measures the amount of unfinished product on your shop floor.
Excess WIP leads to tied-up capital and a reduction in throughput. The goal is to remain lean and efficient, and tracking this KPI will help monitor your throughput.
Changeover Time
Changeover Time is the time it takes to change from one product to another while maintaining production.
The shorter the changeover times the easier it is to schedule production flexibly. Any improvements to your changeover times will increase productivity.
Planned Downtime vs. Unplanned Downtime
This KPI allows you to see planned machine downtimes (usually for scheduled maintenance) vs. machine downtimes caused by other issues.
Downtimes caused by unplanned issues can ruin the best schedules. Measuring this KPI will help you see a worrisome trend in other machine maintenance and act accordingly to replan the work.
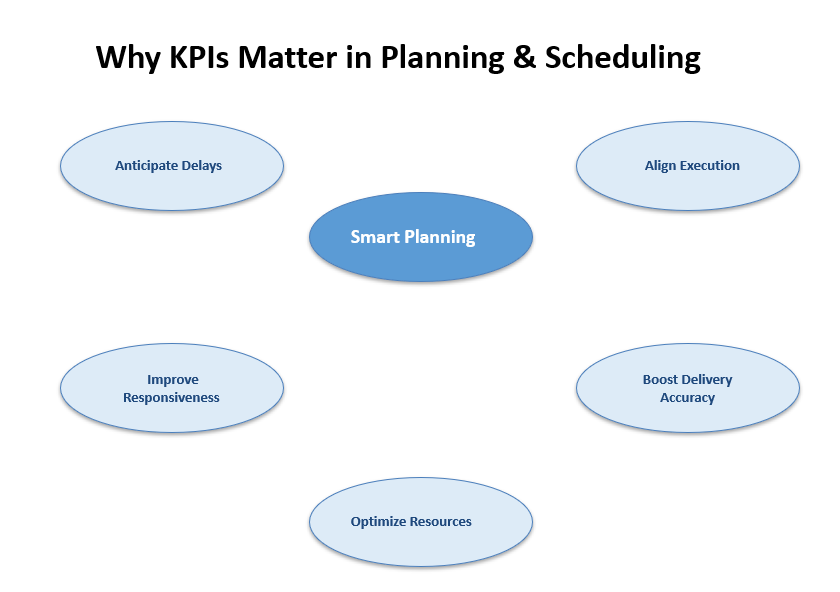
Why These KPIs Matter
Measuring these KPIs provides manufacturers with:
- Insights in advance of delays or inefficiencies
- Better correspondence of plans with execution
- Improved responsiveness to demand changes
- Higher accuracy of deliveries and customer satisfaction
- Better use of machines, materials, and people
Manually measuring these metrics is often complicated and can be time-consuming. This is where ManufApp can step in and help you.
Plan Smarter with ManufApp
ManufApp ERP can support you in measuring planning and scheduling KPIs in real-time. You’ll receive alert notifications and monitor schedules using intelligent dashboards so that you are never caught off guard.
ManufApp includes:
- Live schedule alerts and tracking
- Dashboards measuring capacity and resource utilization
- Work in progress and changeover monitoring
- Planning functionality for departments working together
- Performance monitoring that you can access on the go
To remain competitive in today’s manufacturing environment, determine what metrics should be measured and then track them accurately. With supply chain intelligence from ManufApp, you will have the data to inform your planning for continuous improvement.
Book your free hit demo and see how ManufApp can help you transform your planning and scheduling.